ANALYSIS & SYNTHESIS
National Museum of the Mighty Eighth Air Force
Problem
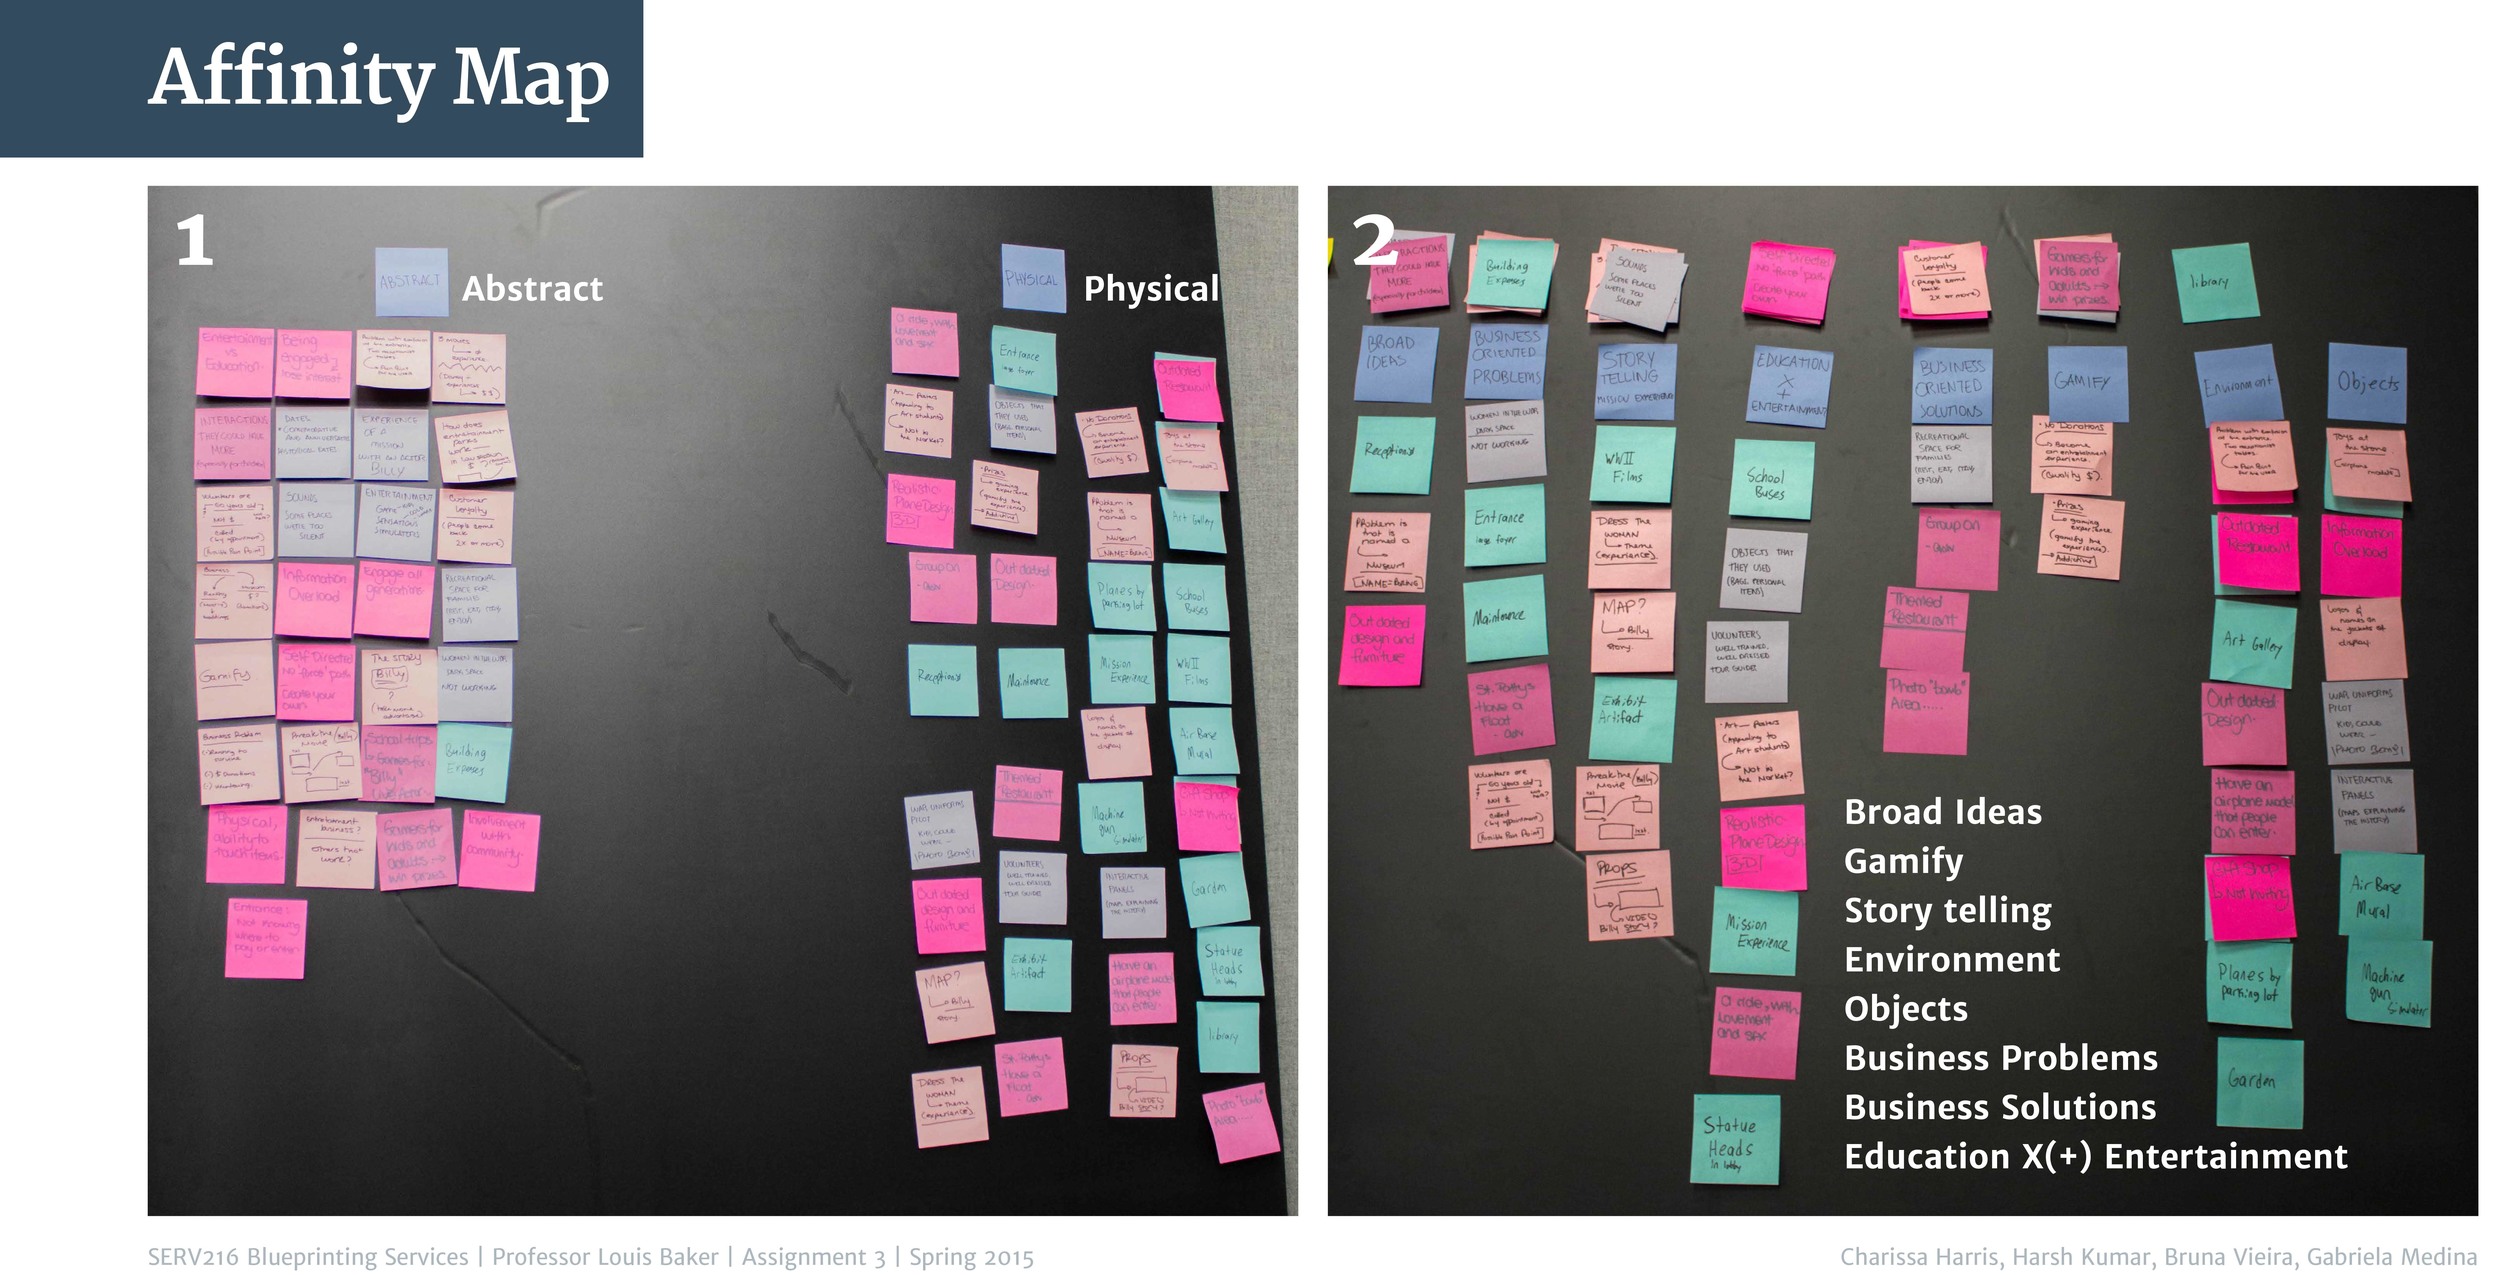
After conducting secondary and then primary research at a The National Museum of the Mighty Eighth Air Force, the students were tasked with organizing and grouping Insight Cards based on affinities, similarities, dependency, or proximity, creating a chart containing the macro areas that mark the boundaries of the subject under consideration, its subdivisions and interdependencies. This enabled them to synthesize the data by identifying patterns.
Approach
After considering the various patterns identified as intermediate research outcomes, the students learned and gained practical experience using tools and methods that helped them uncover deeper insights, identify design opportunities, frame strategic problems and generate ‘initial’ ideas.
Solution
During their presentation the team was able to discuss contradictions to their initial hypothesis, and to “build a case” based on research and logic. They documented their experience and observations by presenting an affinity map. This data was further explored, visualized, and condensed with tools including fishbone diagrams, gap analysis, four action framework, framed strategic problems and initial solutions.
affinity map
fishbone diagram
gap analysis
four action framework
framing strategic problems
initial solutions
Result
My students learned that analysis is best when performed by a multidisciplinary team working in a collaborative fashion, so that no single bias prevails in the analysis. In this process, subjects, subgroups and criteria are often identified that assists in understanding the data. It can be rearranged a number of times by different groups, depending on the complexity of the subject and the volume of data. It is important that each stage is recorded as the results are needed to aid in the understanding of the field data, and to create tools in the ideation process.


